What the Hell Is a Graph and Why Is It Make-or-Break for Machine Customers?
Why customer focused leaders who understand graph infrastructure will lead MCX transformation (and those who don't will be left behind)

A procurement AI just evaluated 47 vendors in 90 seconds. You weren’t one of them.
It wasn’t because your product isn’t good or that your pricing is wrong. It’s because you don’t exist in the graphs that machine customers use to understand commercial reality.
Confused? Let me explain.
What Are Graphs, Actually?
A graph is just a map of how things connect. Think family trees, org charts, subway maps. There are nodes (things) connected by lines (relationships). A simple concept with profound implications.
Originally a journalism major, I did a tour of duty at Reuters in the late 2000s doing soul-crushing work with Dublin Core (IYKYK), building semantic taxonomies so news could be categorised and found. I was creating structured metadata so systems could understand “this article is ABOUT economics AND relates to European Central Bank AND mentions inflation.”
We were manually building what are now called knowledge graphs, maps of how information connects. It was eye bleeding work, but we were solving a real problem: how do you help people and systems understand meaning, not just match keywords?
The evolution happened in three waves. In the 2000s, humans like me manually tagged content, building Dublin Core taxonomies…one painful entry at a time. Then in the 2010s, Google automated this at scale with their Knowledge Graph launch, suddenly able to understand entities and relationships across billions of web pages. Now in the 2020s, AI agents actually use these graphs to make decisions through systems called Graph-RAG.
Stick with me. I promise this is not a text book entry or tech-y historical deep dive.
All that painful taxonomy work was actually building the infrastructure machine customers now use to understand commercial reality so I feel somewhat virtuous having contributed in my own small way.
Why Machine Customers Think in Graphs (And Humans Don’t)
Some stuff changed in 2025 that makes this matter right now in machine customer experience.
Machine customers stopped being theoretical and became transactional. In late 2025, Visa launched its Trusted Agent Protocol and completed hundreds of secure agent-initiated transactions with partners. Mastercard unveiled Agent Pay in April 2025, enabling AI agents to make purchases on behalf of consumers using tokenized credentials. OpenAI partnered with Stripe in September 2025 to launch “Instant Checkout” for Etsy within ChatGPT—shoppers can now discover products and complete purchases without leaving the chat interface.
By December 2025, Visa announced that agentic commerce would become mainstream in 2026, with millions of consumers expected to use AI agents for holiday shopping. The infrastructure is live: Google’s Agent Payments Protocol has 60+ partners including PayPal, Mastercard, and Coinbase. Major processors like Fiserv are integrating agentic payment frameworks at scale. Adobe data shows AI-driven traffic to retail sites surged 4,700% year-over-year by July 2025.
And crucially, these agents, acting as machine customers, don’t evaluate vendors or read content like we do.
Human customers read your About Us page and form an impression. They trust based on feeling, brand vibe, and website aesthetics. When you say “enterprise-grade security,” they remember it without needing to verify. They make decisions through narrative or even that gut sense of “this feels right.”
Machine customers can’t process narrative or interpret vibes effectively. They work best with structured, queryable facts. They don’t want to hear “we’re trusted by Fortune 500s”. They need a verifiable list of Fortune 500 clients with relationship data. They struggle to maintain context unless it’s stored in graphs they can query across sessions. When evaluating “Does this vendor match my criteria?” they work most reliably when traversing connected data points.
The fundamental difference
Humans are pattern-matching storytellers. We can hear “innovative cybersecurity leader” and mentally connect that to our needs.
Machine customers are graph-traversing reasoners. An agent can process unstructured text, but it works far more reliably with structured entities and relationships. I know…text book talk. Let’s try a ‘for example’. Instead of reading 'we're a leading cybersecurity provider,' the agent needs to see that you're categorised as, say, network security software for large companies. Instead of a testimonial saying 'trusted by major companies,' it needs a verifiable list showing you work with specific organisations. Instead of 'integrates with your existing systems,' it needs to know exactly which business systems you connect to, like your customer database, your security tools, your support ticketing. Make sense?
Ok. Let’s go back to graphs and why they matter here. When an agent queries 'Find network security software that integrates with customer databases and has analyst validation,' graph-structured data lets it traverse those relationships confidently. When your information is buried in unstructured marketing copy, the agent might find you or might hallucinate details, miss key facts, or deprioritise you due to uncertainty.
Graph structure not only makes you discoverable. It makes you reliable to machine reasoning.
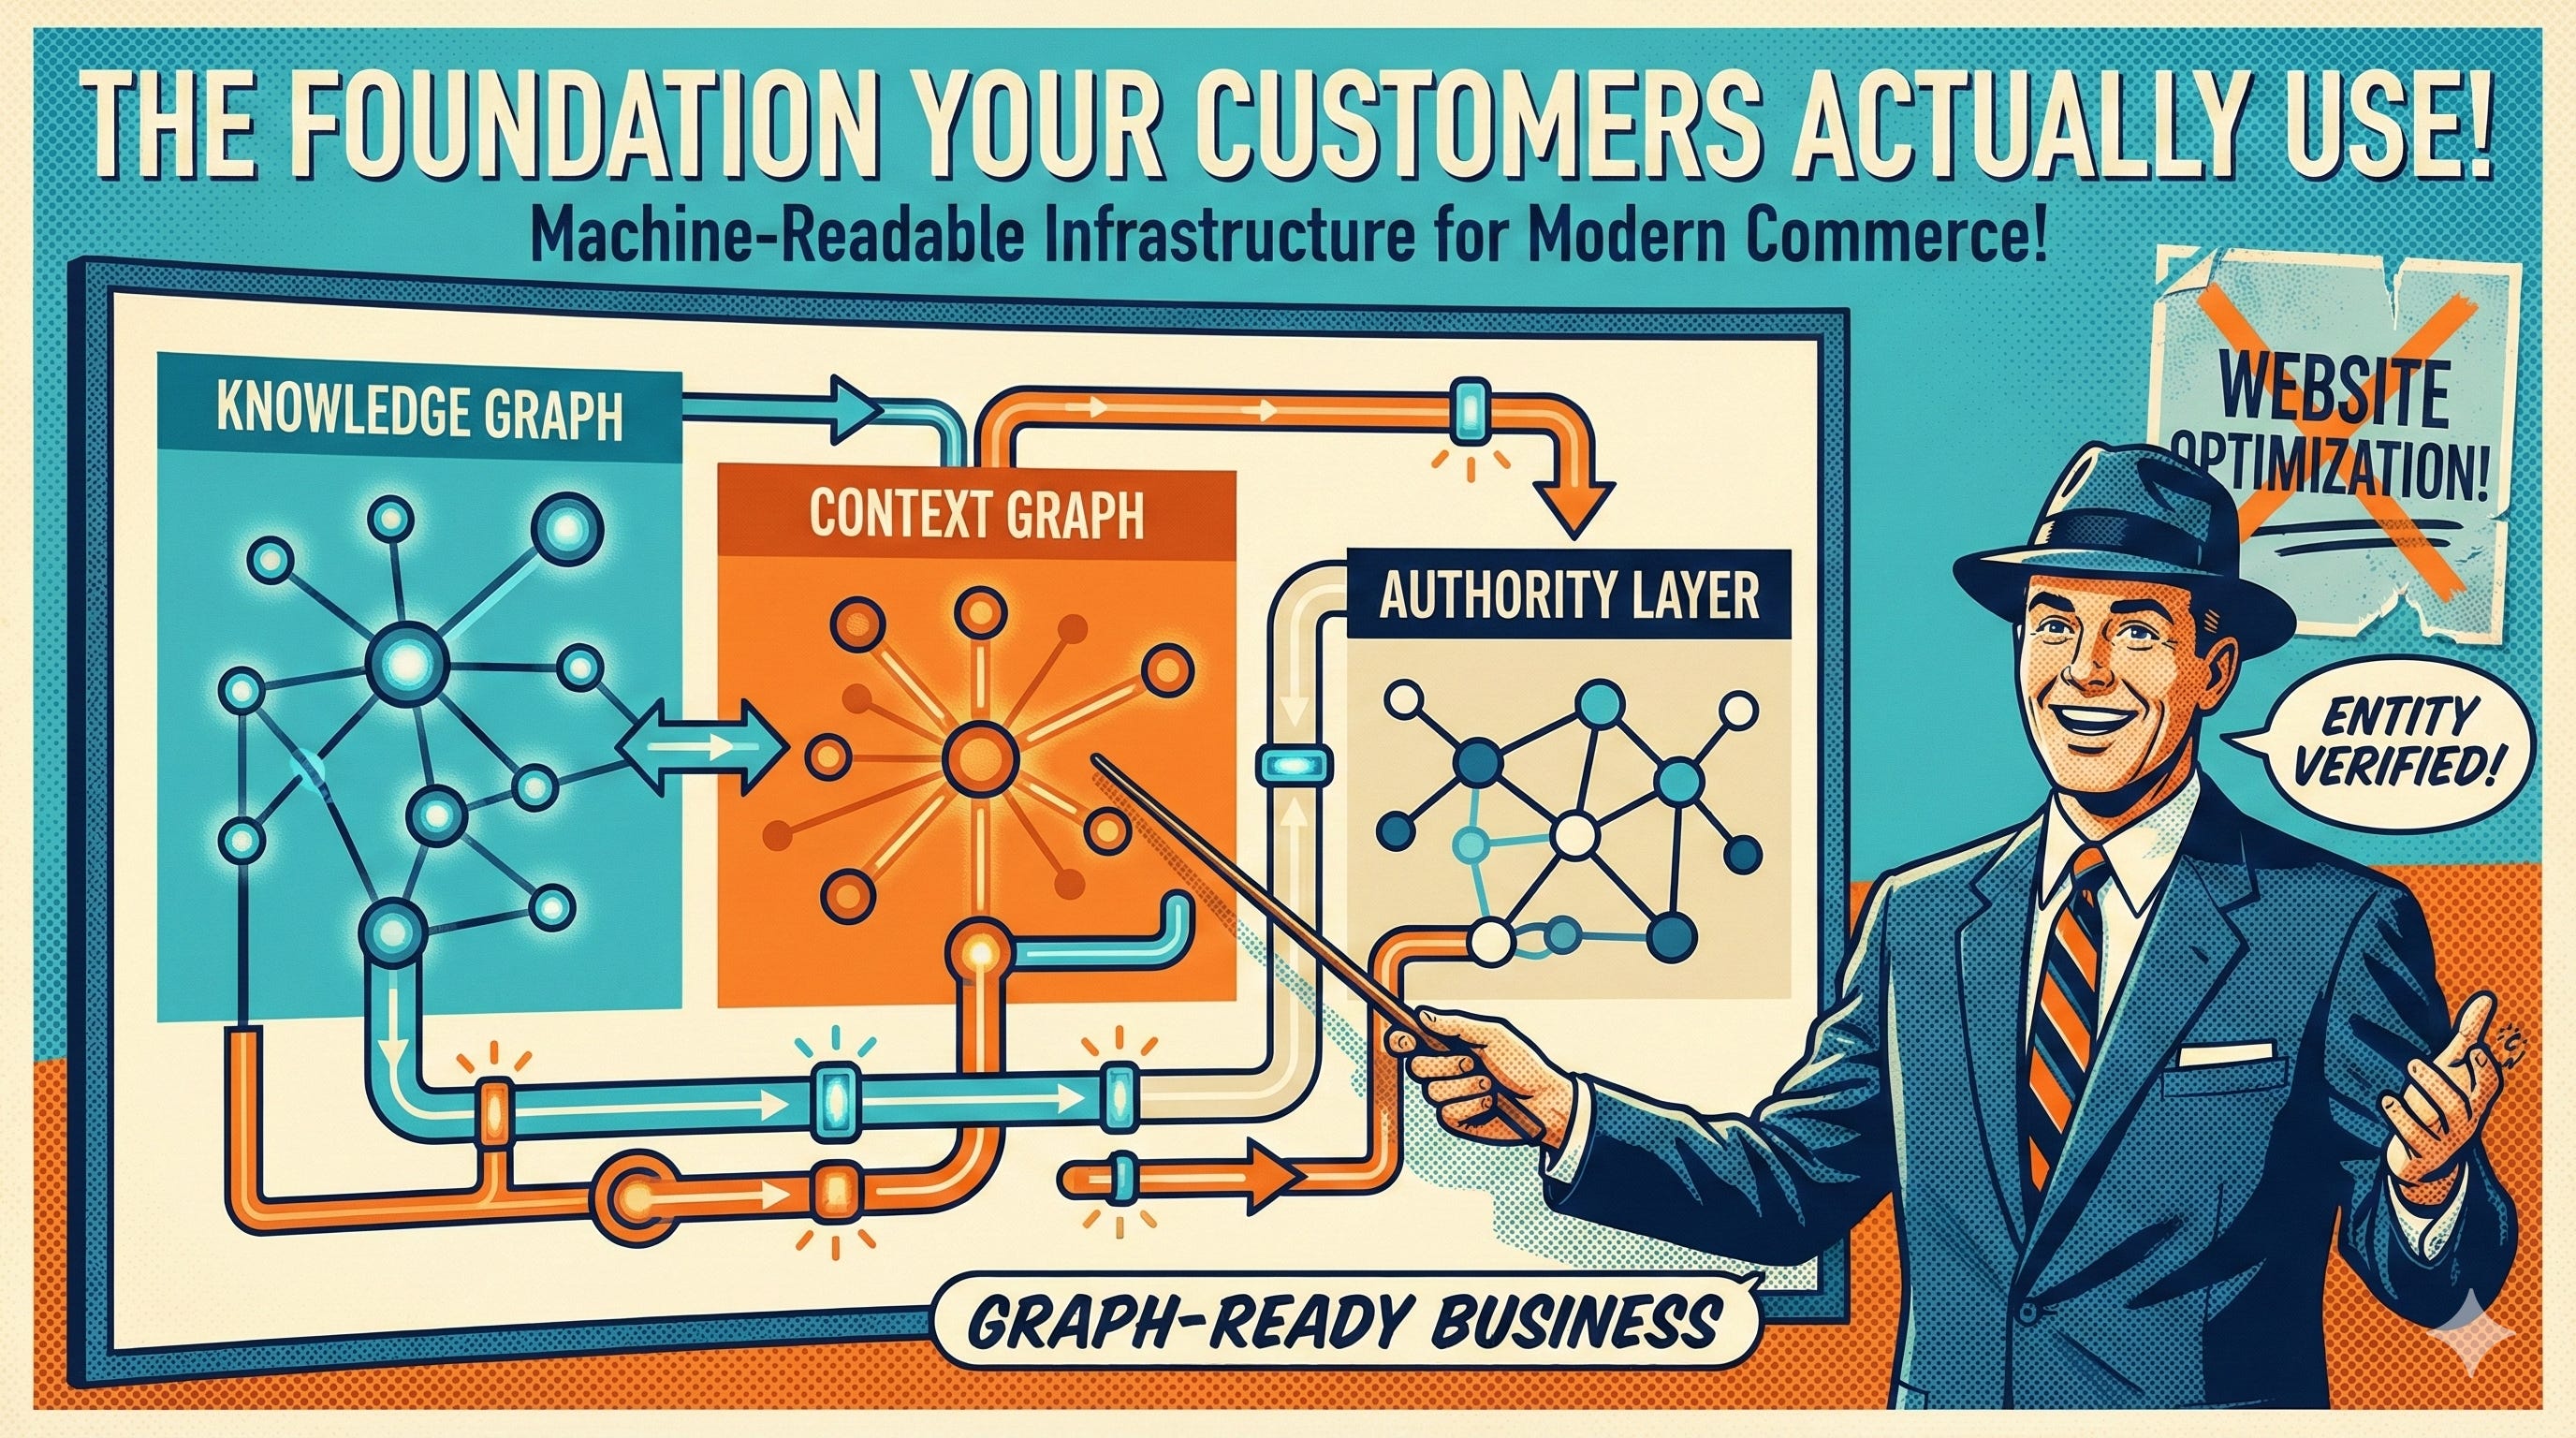
The Three Graph Types That Power Machine Customer Decisions
You’ve experienced these graphs but maybe you just didn’t know that’s what they were called.
When you search “running shoes” on Google Shopping:
It shows you products that exist
It understands “running shoes” vs “dress shoes”
It knows Nike and Adidas are related brands
It surfaces highly-rated options first
That’s a product graph (which is a specific version of a knowledge graph) doing multiple things simultaneously. Google built maps of what products exist, how they relate, what people chose, and which ones are trustworthy. It contains a mind boggling 35 billion product listings (and counting)!
So when YOU were shopping, you were querying that graph manually through a search box. When a machine customer shops, it queries those same graphs directly, plus dozens more you’ve likely never heard of.
Let’s explore why three specific types of graphs are becoming the foundation of agentic commerce.
1. Knowledge Graphs or “The Map of What Exists”
Think about the knowledge graphs you might already interact with. Google’s Knowledge Graph powers search results and the information panels that appear when you search for…well…basically anything. Wikidata serves as an open knowledge base that countless AI systems reference. Crunchbase maintains company and funding data that investors and analysts query constantly. LinkedIn’s Economic Graph maps the relationships between professionals, companies, and skills across the global workforce.
Thinking about getting the attention of machine customers, this is how an agent discovers you exist. Everyone bleating about AIO/AEO/GEO or whatever TLA you decide replace SEO with is missing the bigger picture. If you’re not a coherent entity in these graphs, with consistent information across platforms, you’re effectively invisible.
2. Context Graphs or “The Map of Why Decisions Happened” (THIS IS NEW)
This is the game-changer you may not have heard of or grasped it’s importance for agentic commerce.
I can explain this as decision traces captured as data so when an AI agent makes a purchasing decision, the reasoning gets stored as structured information that other agents can query. Zzzzzz…snoozzzzeee… huh what?
Let’s go for an example instead. When Walmart's procurement AI chose Vendor X over Vendor Y, the why got written down in a format other AIs can read. That reasoning…maybe something like 'better delivery track record in Q3, 15% cost advantage on bulk orders, API compatibility score of 94%'…becomes searchable data. The next procurement agent doesn't start from scratch. It can read and copy the last agent's homework.
As Foundation Capital recently noted, the agent layer stops being 'just automation' and becomes the place the business goes to answer 'why did we do that?'.
So, as decision traces accumulate, context graphs grow.
3. Authority Layers or “The Map of Who to Trust”
Not specifically a graph but more hierarchical chains that define “ground truth” and verification paths for decision-making. Yeah ok…what is that when it’s at home?
Think of how different fields establish credibility. In medicine, authority flows from evidence to clinical guidelines to practitioner expertise to patient outcomes. In law, it moves from statute to legal precedent to court enforcement to public trust. For example, in B2B software purchase, machine customers navigate from analyst reports to technical verification to customer outcomes to performance data. Each field has its own authority hierarchy, and machine customers follow these paths religiously.
Machine customers don’t “trust your brand.” They can, however, navigate authority hierarchies to determine credibility at each decision layer.
What this might look like for enterprise software purchasing:
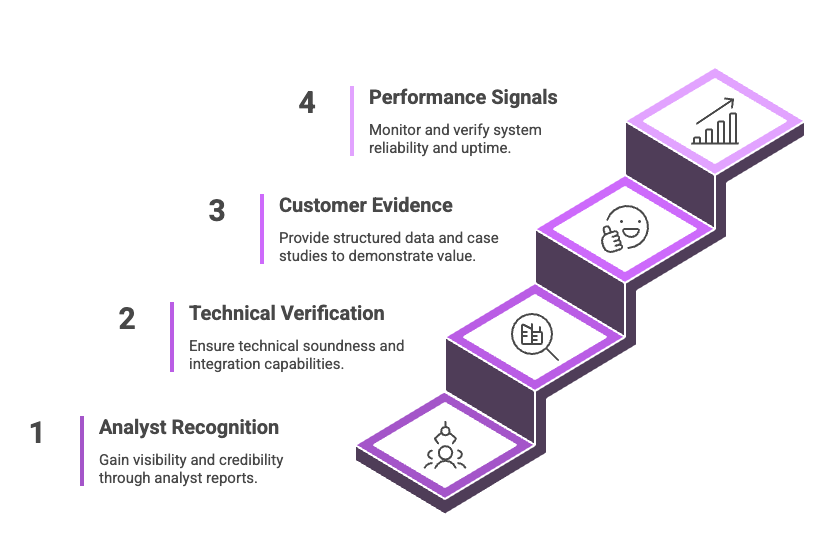
Layer 1 - Analyst Recognition:
Are you mentioned in Gartner Magic Quadrants?
Do you appear in Forrester Wave reports?
What’s your positioning?
Layer 2 - Technical Verification:
Are your APIs documented and machine-readable?
Do you have verifiable integration capabilities?
Is your technical architecture validated?
Layer 3 - Customer Evidence:
Do you have structured customer outcome data?
Are case studies machine-queryable?
What does the context graph show about your implementations?
Layer 4 - Performance Signals:
What’s your verified uptime data?
Are SLAs machine-readable and monitored?
Do you have real-time reliability metrics?
If you’re weak in any layer, machine customers deprioritise you, regardless of your human brand strength.
Why Content Strategy Matters More (Not Less) Than Ever
I have made a connection that makes my Reuters pain worthwhile.
All that content strategy work, like semantic clarity, structured metadata, consistent terminology, wasn’t wasted. It’s more critical now.
But instead of tagging articles, you’re structuring your entire commercial presence.
The questions have evolved completely.
Back in 2009 during my Reuters days, I worried about whether articles were tagged correctly so humans could find them. I deliberated over whether the taxonomy supported easy browsing. I made sure related articles were properly linked. It sucked.
Now in 2026, as the machine customer era evolves, the questions have changed to things like “Is your company defined consistently across Wikidata, Crunchbase, and LinkedIn? Are your products semantically categorised so AI systems understand what you actually sell? Are your capabilities mapped so agents know which APIs to query? Are your customer outcomes structured as decision traces? Do you exist in all the authority layers that machine customers systematically check?”
Feeling overwhelmed? Me too. The simple, yet fundamental shift is this.
Content strategy was about making information findable for humans.
Graph strategy is about making your business understandable and verifiable for machines.
The skills transfer directly.
How We Could Implement This
I don’t want to waffle on about this and being all theoretical. Anyone who reads my stuff knows there’s always going to be a “Here’s what to do starting Monday morning”.
So let’s G…O… Go!
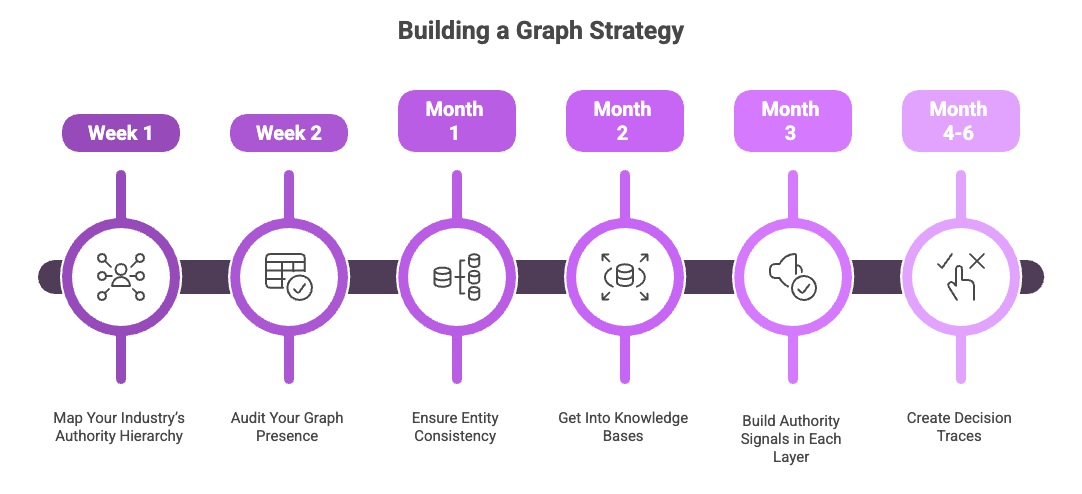
Week 1: Map Your Industry’s Authority Hierarchy
Start by understanding what layers machine customers in your industry check when evaluating vendors. For example, B2B SaaS, this typically begins with analyst recognition from firms like Gartner, Forrester, or IDC. Then comes technical documentation quality and the integration ecosystem. Customer outcome data matters, followed by performance and reliability metrics, and finally security certifications.
In healthcare, the hierarchy looks different. It starts with regulatory approvals like regulator clearance (FDA, TGA, CE…or your local version), then moves to clinical validation data and provider network relationships. Patient outcome metrics come next, followed by interoperability standards compliance.
Get it?
Write down your industry’s hierarchy. Ask yourself: “If a machine customer evaluated us today, what would it check and in what order?”
Week 2: Audit Your Graph Presence
Start with an entity consistency check. Google your company name along with “Wikidata” and see what comes up. Check your Crunchbase profile. Review your LinkedIn company page. Search for yourself in relevant industry databases.
Now ask yourself some hard questions. Is your company described the same way everywhere? Are your products categorised consistently across platforms? Can a machine actually understand what you do, or is it buried in marketing speak? Are there conflicting signals about your offerings that would confuse an AI agent?
Then do a semantic clarity check. Can an AI agent understand your product categories using industry-standard terminology? Are your capabilities described in ways that other systems can parse and understand? Is your technical architecture machine-readable, or locked away in PDFs and slide decks?
I know, I know…it seems like that eye bleeding work again but trust me, it will be worth it!
Month 1: Ensure Entity Consistency
Pick one fundamental description of what your company does and what you sell. Make it specific, not “innovative solutions” but “enterprise endpoint protection software.” Use industry-standard terminology. What do analysts call your category? Make it machine-parseable with clear attributes instead of flowery marketing language.
Then update this description everywhere. Your website metadata, LinkedIn company description, Crunchbase profile, About sections across all platforms, and product documentation should all tell the same story in the same language.
Month 2: Get Into Knowledge Bases
Focus on four priority targets. Start with Wikidata—create or improve your company entry there. Claim and complete your Crunchbase profile. Identify and populate relevant sector-specific databases for your industry. And implement Schema.org markup on your website.
Why does this matter? These are the “anchor graphs” that AI systems cross-reference to verify information. When a machine customer queries multiple sources and finds consistent information, your credibility score increases. When it finds inconsistencies or gaps, you get dumped.
Month 3: Build Authority Signals in Each Layer
For each layer in your authority hierarchy, you need to establish presence and verifiable signals.
At the analyst layer, engage with firms like Gartner and Forrester to get category mentions. Participate in analyst inquiries when they’re researching your space. Most importantly, ensure that any research mentions about you are factually correct and remember, machines will query this data.
For the technical layer, publish machine-readable API documentation. Create integration guides that agents can parse. Make your technical specifications queryable rather than hiding them in the bowels of your site or unavailable to public web crawls.
The customer evidence layer requires you to structure case studies as data, not just stories. Make customer logos verifiable through LinkedIn relationships. Create outcome metrics that agents can actually query, not just testimonial quotes, but structured performance data.
Finally, at the performance layer, publish uptime data publicly. Make your SLAs machine-readable with clear parameters. Create real-time status pages that agents can monitor automatically.
Month 4-6: Create Decision Traces
This is advanced work, but it’s powerful. When customers choose you, start documenting the reasoning as structured data. What specific requirements did you meet? How did you compare to alternatives they evaluated? What decision factors actually mattered in their selection process? What were the measurable outcomes after implementation?
Make this information queryable within appropriate privacy and competitive boundaries. Don’t worry. You won’t be exposing proprietary customer data, you’re creating anonymised decision patterns that future machine customers can reference when evaluating similar purchasing scenarios.
I’ve captured all this as an interactive checklist for you to use. Just hit subscribe!
The Critical Success Factor
Having also done more than 20 years in consultancy, one bullshit bingo phrase does seem apt here. Don’t try to boil the ocean.
Pick one authority layer where you’re weak and fix it completely. Then move to the next.
Graph presence compounds. Each improvement makes AI agents more likely to surface you, which creates more context graph evidence, which strengthens your authority position.
Get Found or Get Ignored
Reflecting on that Dublin Core work that made my eyes bleed in 2009, I was annoyed that systems couldn’t just “understand” content naturally.
Now they can but only if that content is structured the way those systems think.
Machine customers are those systems and they’re evaluating vendors right now.
The difference between being considered and being invisible will come down to graph presence. Not brand strength. Not marketing budget. Graph position.
Your beautiful brand story can reach machine customers through LLMs processing text. But it’s unreliable because agents hallucinate, misinterpret, and lose context.
Your graph position is structured truth that agents can query with confidence.
You win by making your organisation comprehensible to machines. Machine customers need graph-structured experiences, not emotional narratives.
Many leaders don’t even know these graphs exist.
Now you do.
What are you going to do about it?
Katja Forbes is the author of “Machine Customers: The Evolution Has Begun” and helps organisations design customer experiences for AI agents, autonomous systems, and algorithmic buyers. Connect with her at thecxevolutionist.ai